How Zoho Analytics can help you measure your business growth?
Importance of Business Intelligence in business growth
Zoho Analytics is naturally created as self-service business intelligence and data analytics software that can easily analyze your business data. It lets you create visually appealing data and insight efficiently.
Zoho Analytics also allows you to import data from a different or wide range of sources as well as Spreadsheet from Microsoft Excel CSV files, PDF, HTML and Zoho sheets.
It also notifies you when appliers or unforeseen situations happen and for you to be prepared for any future events with the help of smart forecasting through Zoho Analytics. You can also feed data from online storage services such as; Dropbox, Google Drive and many other sources.
Now, what Zoho Analytics is created for?
Zoho Analytics can blend and analyze data from multiple data sources.
Zoho Analytics makes sharing and publishing data and reports faster and easier.

Here are some smart features of Zoho Analytics:
1. It has a variety of Visualization
Data reports can be more fun by using many types of charts, widgets, pivot tables and tabular views that can help you in creating insightful reports and dashboards.
Since Zoho Analytics is updated often, a variety of visualization are being added frequently, so you can choose a much more meaningful and seemingly applicable for your reports.
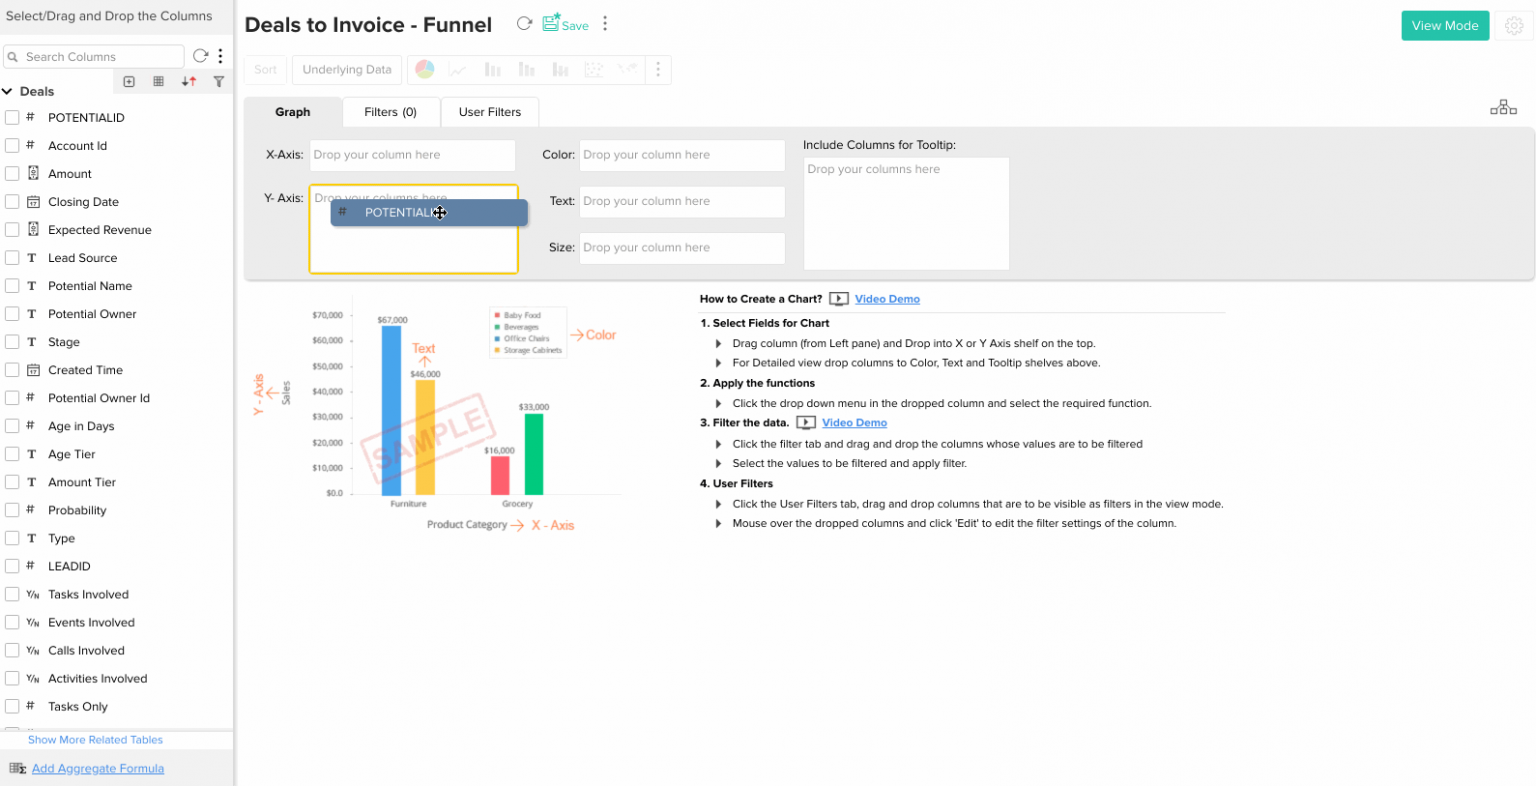
2. Drag and Drop repost feature
Zoho Analytics is up for creating a good visual for reports and dashboard; here is another feature that will surely motivate you to use Zoho Analytics.
It is called the ‘Drag-and-Drop’ creation. It lets you create effortless meaningful reports and dashboard with this Zoho Analytics’ feature.
Definitely, it became a lot easier in creating visualization and can help you minimize the required time to create a new report.
3. Interact!
In addition, with the help of Zoho Analytics you can use interaction options. Like viewing underlying data, contextual filters and drill-downs to help you perform ad-hoc exploratory analysis.
4. It has beautiful dashboards
Using the second feature that we have in Zoho Analytics or the drag-and-drop feature/ designer.
In addition, you can combine not one, but multiple reports into one amazingly beautiful dashboard like Image, formatted texts, widgets and web components. It can help you to track the KPI (Key Performance Indicators) easier and effectively
5. Ask Zia, the AI-Powered Assistant
Zoho Analytics now sports the AI-powered Zia, Zoho’s intelligent assistant. Whether it be questions like ‘Get me the support tickets received this month, by product by region’ or ‘Give me sales by country by channel’, you just ask Zia.
Zia converts such questions asked in natural language to complex SQL queries in the back end. And comes up with multiple relevant report suggestions. You can save the suggestion that best suits you as a report directly.
Business Intelligence became important for a business to better understand its situation at any point in time. It provides meaningful, valuable and important insight into any data.
Moreover, it is also a set of methodologies, processes, architectures and technologies to improve raw data into meaningful information. It will enables strategic and operational insight for business and growth and how it can improve decision making.
Zoho Analytics is a flexible BI that can help you to be productive in any business matters. It also makes your work easier and a lot more exciting with the features that Zoho Analytics has.
Go Biz IT is an authorized Zoho Analytics partner, click the image to see the certificate![]() . If you need help with Zoho Analytics, please don’t hesitate to contact us
. If you need help with Zoho Analytics, please don’t hesitate to contact us
Want To Learn More About Remotely Running Your Business?
let’s talk


